
A 10-Step Checklist for Stress-Testing New Trading Systems
The structural barrier separating individual retail operators from institutional-grade risk management infrastructure has collapsed. Armed with high-fidelity, sub-second tick data and advanced simulation processors, any algorithmic trader can now expose a systematic model to years of severe market anomalies in a matter of seconds.
To safeguard operational capital, you must transition your verification process beyond basic historical backtesting—which merely indicates whether a strategy used to work—and deploy comprehensive stress-testing, which identifies exactly when, where, and why a strategy will structurally fail.
1. The 10-Step Institutional Stress-Testing Checklist
Before allocating active capital to any new algorithmic system, route it through this multi-layered risk validation gauntlet.
Step 1: The Historical “Black Swan” Jump
Force your engine to execute exclusively through extreme historical liquidity vacuums. Use your platform’s precise “Jump to Date” parameter to isolate performance metrics during major systemic breaks: the 2020 Liquidation Cascade, the 2022 Inflation Regime Shift, and the high-velocity market transitions of early 2026.
Step 2: Monte Carlo Return Shuffling
Run a minimum of 10,000 algorithmic simulations where the sequence of your historical trade outcomes is randomly shuffled. If scrambling the order of returns triggers a sequence-of-returns drawdown that liquidates your test balance, your edge depends on sequential luck rather than true mathematical expectancy.
Step 3: Parameter Sensitivity Sweeps
Systematically alter your core technical indicators by minor increments (for example, shifting an RSI length from 14 to 13, 15, or 16). If your strategy’s net profit vanishes or reverses during a minor setting modification, the logic is dangerously overfitted to past noise and will fail in live conditions.
Step 4: Walk-Forward Optimization (WFO)
Divide your data sets rigorously. Train and optimize your variables strictly within a historical window (e.g., 2023–2024 data), and run an absolute “blind test” on completely unoptimized, out-of-sample data (e.g., 2025–2026). If your out-of-sample Sharpe ratio or net performance decays by more than 50%, your model’s predictive edge has dissolved.
Step 5: Friction, Latency, and Slippage Modeling
Instantaneous execution fills do not exist in live professional environments. Inject a mandatory minimum baseline of 0.05% execution slippage alongside a 100ms transmission delay onto every individual order block inside your simulation engine to evaluate your structural survival rate.
Step 6: The Fee Structure Audit
Verify whether your model preserves its alpha after accounting for exchange fee tiers. High-frequency scalping setups that look flawless on paper frequently convert into pure commission-generating engines for the broker once maker/taker clearing fees are calculated.
Step 7: Drawdown Duration Calibration
Do not evaluate drawdowns solely by their percentage depth. Measure the absolute duration of the drawdown. You must verify whether your trading operation can withstand 4 to 6 months of continuous equity stagnation without manual or emotional intervention.
Step 8: Multi-Asset Correlation Cross-Testing
Cross-test your core strategy logic across highly correlated instruments. If you have engineered an algorithmic model tailored for Bitcoin (BTC), run the same logic across Ethereum (ETH) or high-beta Layer 1 assets. Robust structural edges should persist across closely related market regimes.
Step 9: Volatility-Regime Filtering
Isolate your strategy’s performance metrics based on macro volatility bands (such as tracking execution when the VIX sits sustainably above 25). If your system only prints positive returns during quiet, compressed conditions, it is a fair-weather model that risks liquidation during systemic expansions.
Step 10: The Index Baseline Hurdle
Compare your system’s risk-adjusted metrics (specifically the Sortino and Sharpe ratios) directly against a passive index benchmark, such as buy-and-hold BTC or the S&P 500. If your automated model cannot outperform the basic index baseline on a risk-adjusted basis, you are absorbing massive operational stress for sub-baseline compensation.
2. Infrastructure: Premier Testing & Automation Platforms
The optimal framework for executing this gauntlet depends entirely on your programming proficiency, asset specialization, and execution style.
| Verification Venue | Primary Domain | Notable Technical Advantage |
| QuantConnect | Advanced Quantitative Research | Cloud-based LEAN engine supporting multi-asset Walk-Forward Optimization and alternative data ingestion. |
| TradingView | Visual Charting & Prototyping | Pine Script engine providing frictionless multi-symbol historical backtesting against institutional tick data. |
| MetaTrader 5 (MT5) | FX / CFD Programmatic Algos | Highly optimized Strategy Tester utilizing multi-threaded processing for fast genetic optimization sweeps. |
| Cryptohopper | Cloud-Native Crypto Automation | AWS-powered serverless backtesting engine allowing instant structural strategy verification and 24/7 automated cloud deployment. |
| TrendSpider | No-Code System Exploration | Completely code-free automated strategy testing designed to extract pattern-based technical edges instantly. |
Selecting the Right Partner
For high-velocity spot and derivatives trading within traditional FX and global contract markets, routing your system through advanced execution brokers like RoboForex gives you direct access to multi-threaded MT5 strategy engines. This enables high-speed genetic optimizations across decades of deep liquidity data.
If your focus is centered completely on digital assets, deploying your models via automated cloud infrastructure like Cryptohopper enables you to construct, backtest, and stress-test automated bots using serverless computing power. This setup allows you to seamlessly transition validated models directly into paper trading or live cloud execution without maintaining active local terminal hardware.
3. The Professional Strategy Stack
Sophisticated systematic traders rarely run their entire operation inside a single platform. Instead, they isolate each component of their workflow to eliminate single points of failure and optimize operational latency:
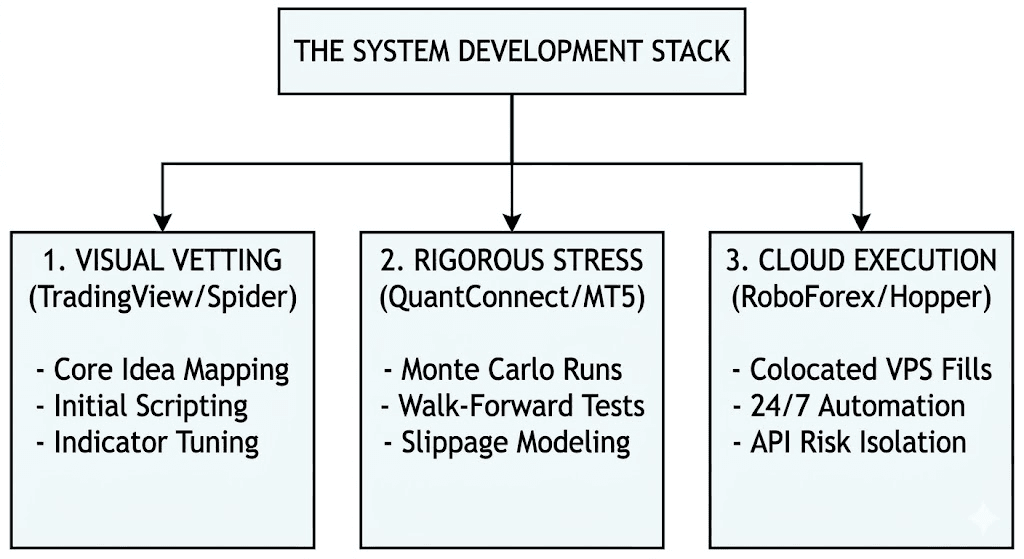
- Analysis & Ideation: Utilize highly visual terminal suites like TradingView or TrendSpider to conduct preliminary charting, map visual market anomalies, and validate raw structural concepts.
- Stress Simulation: Port the core algorithmic logic into specialized testing backends like QuantConnect, MT5, or StrategyQuant to execute heavy-duty Monte Carlo variations and parameter sweeps.
- Production Deployment: Route the finalized, approved model parameters to low-latency cloud systems. Use specialized MT5 execution servers via RoboForex for legacy contracts and macro FX pairs, or deploy automated web-hooks and API nodes via Cryptohopper to command 24/7 crypto execution streams.
FAQ
What is the functional difference between Walk-Forward Analysis and standard optimization?
Standard optimization tests various parameters over a single block of historical data to find the single highest profit metric, which regularly results in overfitting. Walk-Forward Analysis optimizes parameters on a limited segment of historical data (In-Sample), verifies that configuration on a subsequent, untouched segment of data (Out-of-Sample), and moves the window forward progressively to simulate real-world market evolution.
Can I effectively execute Monte Carlo trade randomization within spreadsheet engines like Excel?
Yes. You can build random data shufflers in Excel utilizing native functions or specialized risk macro add-ins. However, modern backtesting suites execute these high-volume randomizations natively across millions of points of data instantly, providing pre-calculated metrics for probability of ruin much faster than a standard spreadsheet canvas.
Why has raw tick data become a fundamental requirement for system testing?
Standard historical minute bars compress market data down to four points: Open, High, Low, and Close. This completely masks the internal sequence of price action inside that specific minute. High-fidelity tick data tracks every individual transaction, which is essential to verify if a fast market spike triggered your stop-loss order before hitting your profit target.
What does the Deflated Sharpe Ratio (DSR) track?
The Deflated Sharpe Ratio is an advanced quantitative metric designed to eliminate selection bias. It adjusts your strategy’s apparent performance downward based on the total number of alternative configurations, parameter sweeps, and failed strategy iterations you tested before arriving at your final “winning” model.
What is the minimum statistical sample size required to validate an automated system?
As a general rule of thumb, you should aim for a minimum historical sample size of 200 to 300 completed trade executions. These trades must be distributed across at least three distinct market regimes—consisting of a prolonged macro bull market, an aggressive structural bear market liquidation phase, and an extended low-volatility sideways consolidation range.